THE FACTS

Side by side comparison

DENIS CLEMENT

PROMISED

  • To Repair More Roads


  • To Pay Off Debt


  • To Lower Taxes

DELIVERED

  • Some of the Lowest Road Spending in 16 years!
  • Raised debt by over $6 Million (50% increase from previous administration).
  • Collected 15% more in new taxes during his term ($1 Million)
  • Increased Water Rates by 30%, with a plan to double by the end of the next term.

PETER POLITIS

DELIVERED IN PREVIOUS TERM

  • $2.5  Million in social development assets
    • Pavilion
    • Boardwalk
    • Trails around Lake
    • Watercraft and Water Slides
  • $11 Million in road repairs (Some of the highest in 16years)
    • 1st Cross Walk in Town
    • 1st Roundabout
  • Over $23 Million in town-driven development (Some of the most per capita in Northern Ontario)
    • Including $10 Million in seniors’ housing development (1st seniors retirement residence outside of Timmins in the region at the time)
  •  All for:
    • 50% less debt than Mr. Clement
    • Same taxes as Mr. Clement (Collected $1 Million in taxes)
    • 30% less in water rates 

Fact or Fiction? - Debt

FICTION:  Cochrane’s Debt is $16 Million and Out Of Control.

FACT: The Town’s Actual Debt is $13.5 million. $16 million is called “consolidated” debt and includes Cochrane Telecom Services which is not paid for by the Tax Payer.

Around $8 Million of this “consolidated” debt was already incurred by the Town and Cochrane Tel before 2011 in basically one term (5 Years). The Remaining $8 Million or so was incurred over eight years (two terms);

We have implemented a forward thinking and modern debt management policy that limits debt burden to no more than 10% of Budget. So, unlike the provincial debt crisis, debt will never be out of control in Cochrane. Currently the debt burden is about 8%. Other municipalities struggling to develop are looking toward this thinking.

FICTION: The debt incurred is mostly related to all the social and recreational developments, and in particular the waterfront developments.

FACT: The $8 million in debt incurred since 2011 is actually about 90% roads, infrastructure and capital equipment. Only $500,000 is associated to all the waterfront developments. Other than the Pavilion, which itself was 75% funded, all other waterfront developments, including the Boardwalk, the new bridge, the Commando Park & trails development, the watercraft & bicycles at the beach, have been fundraised by the Town and the Recreation Board costing the tax payer little to nothing. The Pavilion cost us about $10 per year per residential property, for 25 years.

FICTION: The cost of our debt is massive and we can’t afford it:

FACT: The Town borrows at exceptionally low rates (in the 1.6% – 3% range). The cost of this borrowing is only about 2% of the budget. This is considered strategic and easily affordable borrowing that has generated about $1 Million in additional cash flow for road and infrastructure developments that would not have taken place without it.

Strategic borrowing is not only affordable, it’s an important part of progressive financial management.

Fact or Fiction? - TAXES

FICTION: Cochrane has one of the highest mill rates in the region.

FACT: At 1.62% Cochrane’s residential Mill Rate is actually the lowest comparably in the region.  It has decreased every year since 2011 going from 1.97% to 1.62% today.

FICTION: Cochrane’s residential property taxes are some of the highest in the region.

FACT: At just under $1,800 per residential property, Cochrane’s property taxes are actually some of the lowest.  There’s a lot of misinformation being floated that make all kinds of suggestions associated to the complicated calculation like property values and housing markets, for example.  The fact and “bottom line” is that the average residential property tax bill is under $1,800.  This is the number to focus on.

Our entire tax levy (the amount of money we collect from tax payers) is just over $6 million.  There are communities two thirds our size who collect almost $8 million for comparison.

What's the real skinny on Cochrane's property taxes?

Taxes Paid as % of Average Household Income

Representing about 2.5% of the average household income, property taxes in Cochrane are some of the most affordable comparably.

Average Taxes Paid Per Residential Property

At about $1,800 per residential property on average, Cochrane’s Property Taxes are some of the lowest comparably.

Actual Town Reserves

At over $5 million dollars, Cochrane’s financial reserves are some of the largest in decades, and have grown about 324% since 2011.

Fact or Fiction? - OPERATIONAL COSTS

FICTION: the budget needs a spending freeze and a line by line review.

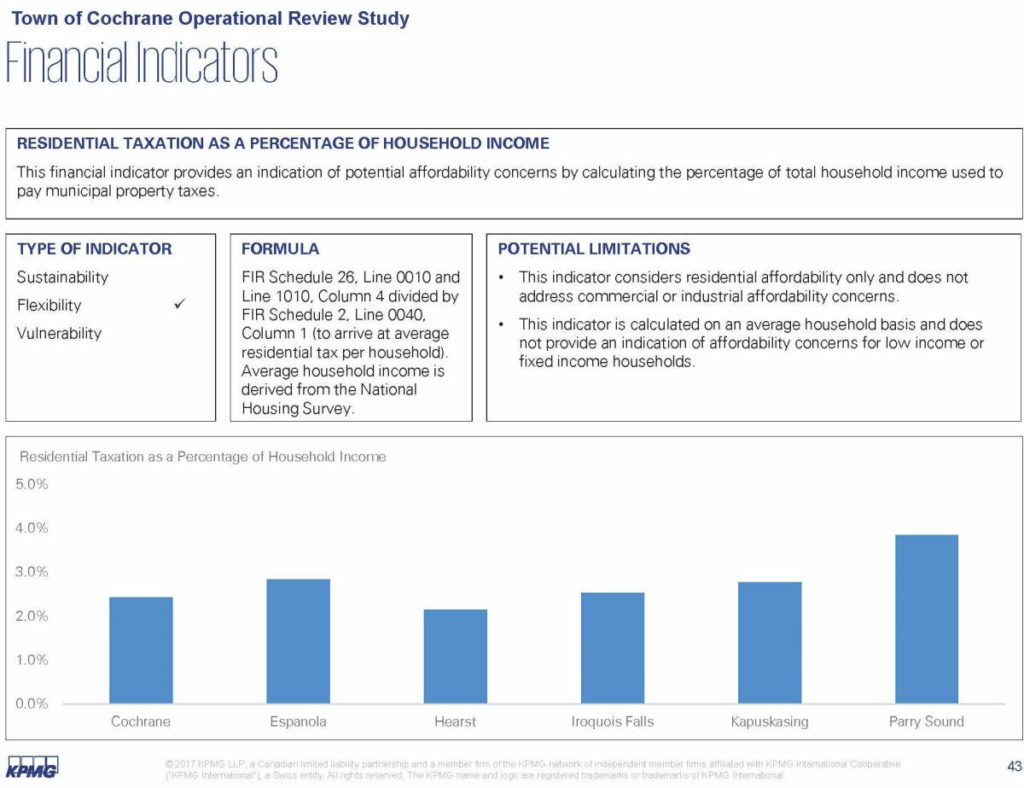
FACT: the budget has been reviewed by one of the most prominent accounting firms in North America (KPMG) both in 2011 and 2016.   KPMG has stated that Cochrane’s financial management is in such good shape, that KPMG uses Cochrane as a benchmark for other communities to follow.

The budget had close to $1,000,000 taken out of it in 2012, effectively wringing the resources to run the operation extremely tight.  KPMG’s second review in 2016 verify’s that the financial management has remained prudent.  Our corporate services department has warned that the budget is run extremely tight and anymore cuts to the budget will result in loss of services.

Modern, progressive and strategic financial management is much more complicated than political slogans around “spending freezes” and line by line micromanagement.  

FICTION:  Town reserves are depleted and the Town is at risk.

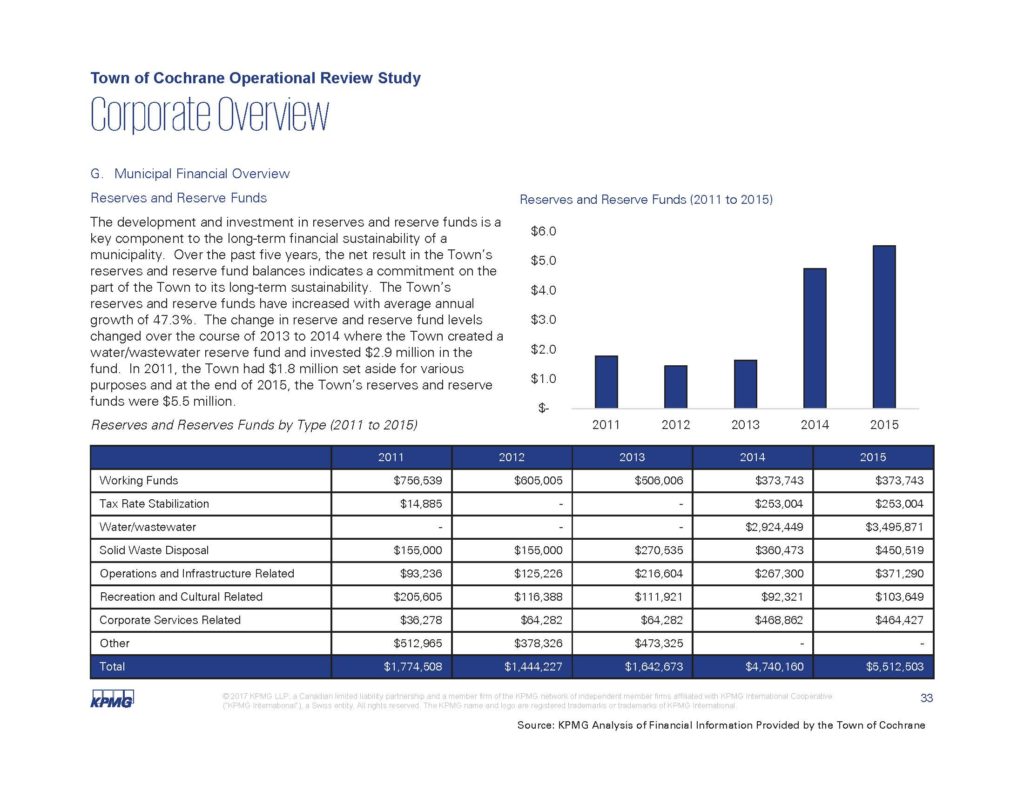
FACT:  Town reserves sit between $4 and $5 million dollars, and have been as high as $6 million last year before Railway Street Reconstruction.  These are some of the highest reserves the Town has had in decades.

The Town is not at risk – To the contrary.  KPMG, one of the the largest financial accounting firms in North America has stated they actually use Cochrane’s financial management as a benchmark for their municipal clients elsewhere to follow.